
大多数房地产分析师预计,2023年美国房地产市场将面临严峻考验。事实上,在29个主要房地产预测模型中,有24个预测2023年全美房价将下跌。
但迄今为止,情况并非完全如此。
在2023年的头几个月里,美国房地产市场持续显示出稳定迹象。今年现有房屋和新建房屋销售略有上升,房地产开发商信心也有所改善。此外,像Zillow、CoreLogic和Black Knight这样的公司都在今年春季报告了月度房价的正增长。
这是怎么回事?首先,随着平均30年固定抵押贷款利率从去年11月的7.37%回落至约6.5%,房屋负担能力在今年春季有所改善。此外,缺乏待售房屋,再加上市场进入繁忙的春季时期,至少目前全美房地产市场已经被推回到了平衡状态。
尽管如此,房地产市场在某些方面仍未完全恢复正常:一些房地产市场(包括斯克兰顿)目前正繁荣发展,而其他地方(包括圣何塞)仍在经历房价调整。甚至在某个特定市场内,情况也可能大相径庭。
为了更好地了解当前房地产市场有多么奇怪和分裂,《财富》杂志制作了七个交互式图表,显示了美国一些最大的州的邮政编码级数据。这些地图表现出从2022年12月到2023年3月,根据季节性调整的Zillow房屋价值指数所跟踪的房价变化。

在Zillow追踪的1559个纽约邮政编码中,48.4%的地区在2022年12月至2023年3月期间房价有所上涨。另有51.6%的地区房价下跌。在2022年同样的三个月时间里,约99%的纽约邮政编码地区出现了房价上涨。
随着4月和5月的房价数据陆续公布,2023年初的部分下跌可能会被抵消。
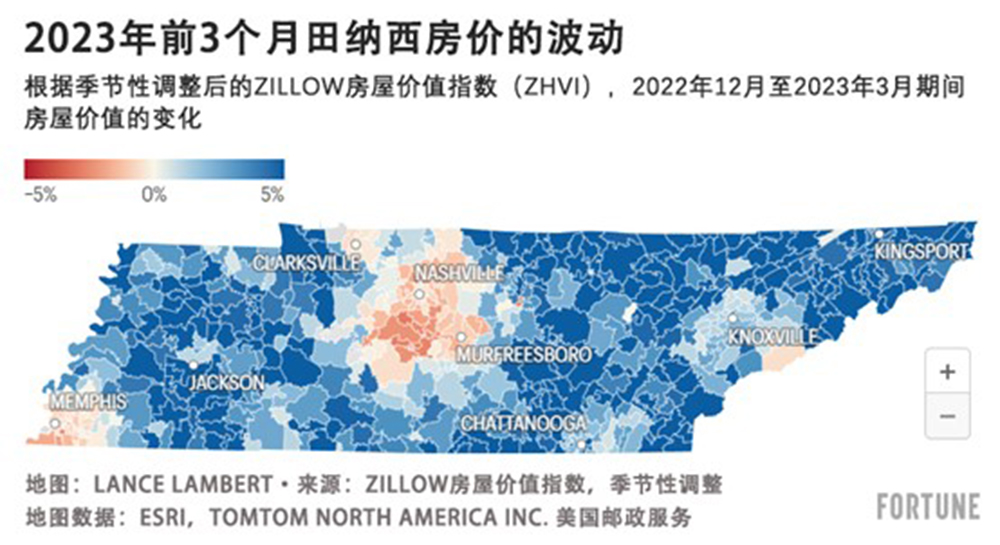
在Zillow追踪的586个田纳西州邮政编码中,83.1%的地区在2022年12月至2023年3月期间房价有所上涨。另有16.9%的田纳西州邮政编码地区房价下跌。

在Zillow追踪的1563个加州邮政编码中,6.7%的地区在2022年12月至2023年3月期间房价有所上涨。另有93.3%的加州邮政编码地区在这三个月的时间里出现了房价下跌。
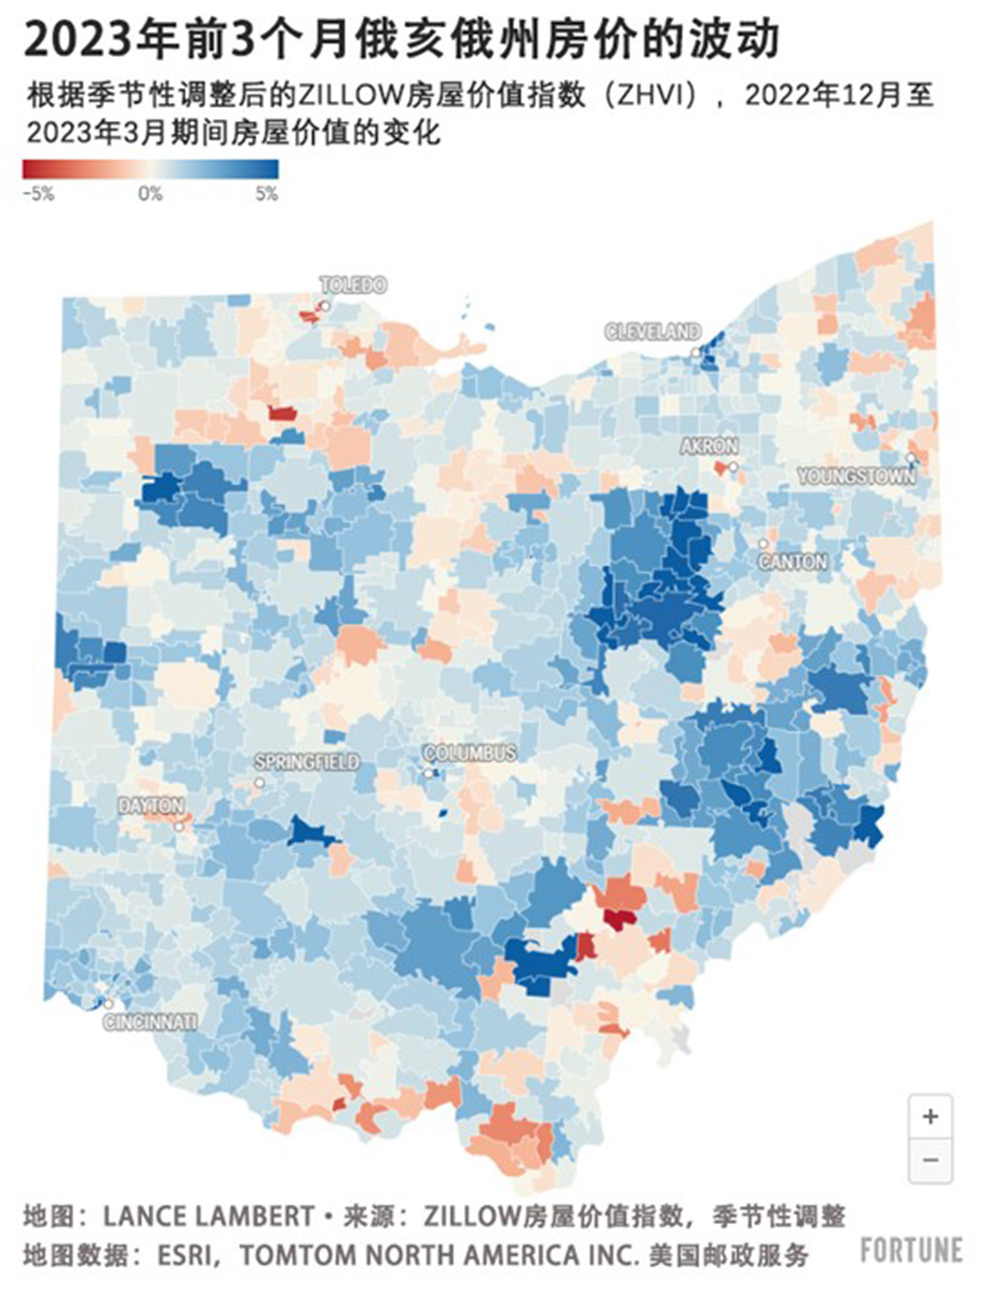
在Zillow追踪的1039个俄亥俄州邮政编码中,76.6%的地区在2022年12月至2023年3月期间房价有所上涨。另有23.4%的俄亥俄州邮政编码地区房价下跌。
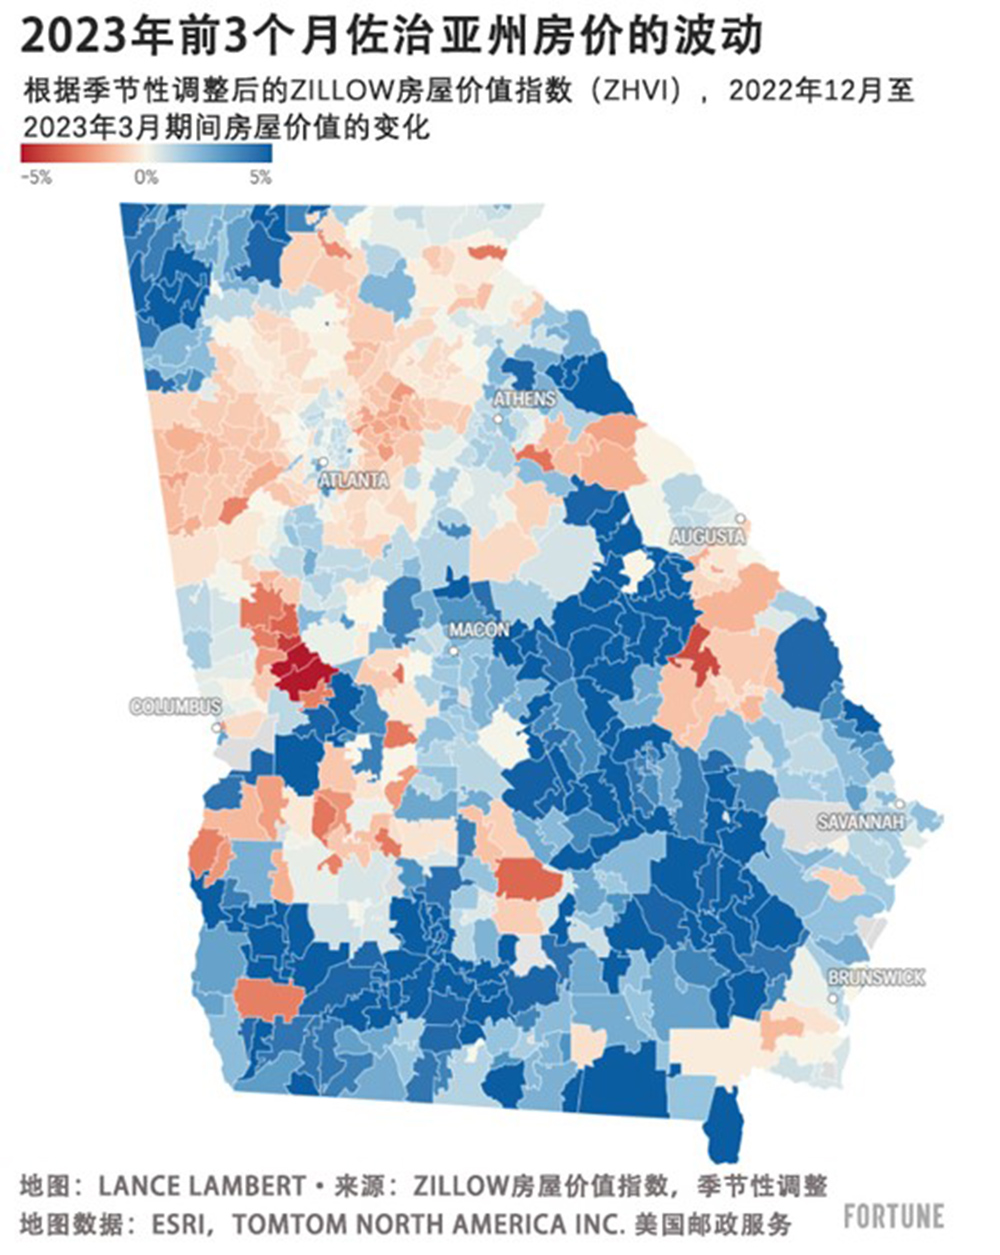
在Zillow追踪的665个佐治亚州邮政编码中,68.3%的地区在2022年12月至2023年3月期间房价有所上涨。另有31.7%的佐治亚州邮政编码地区房价下跌。
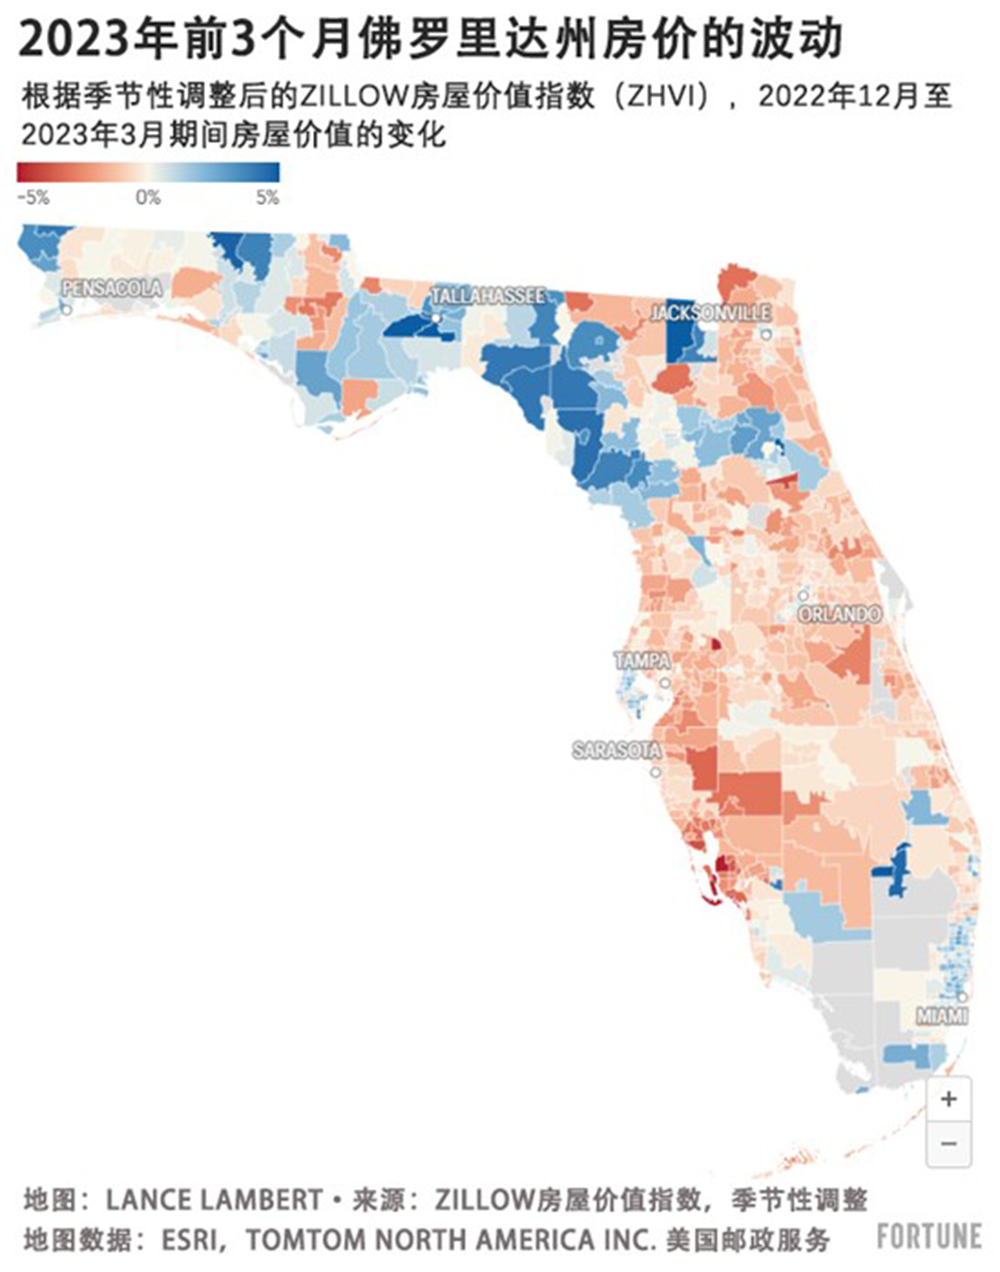
在Zillow追踪的926个佛罗里达州邮政编码中,33.7%的地区在2022年12月至2023年3月期间房价有所上涨。另有66.3%的佛罗里达州邮政编码地区房价下跌。
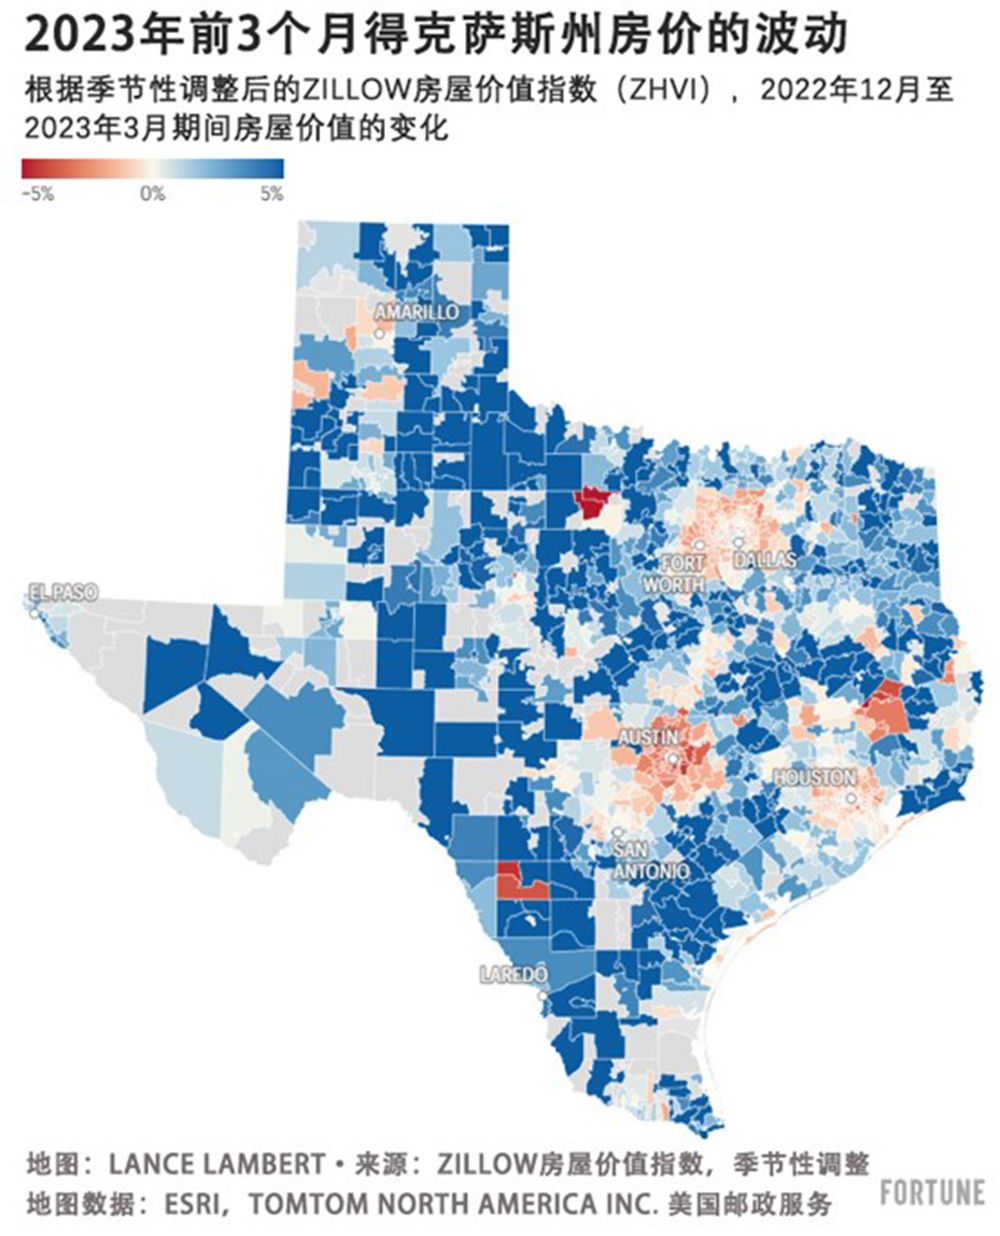
在Zillow追踪的1554个得克萨斯州邮政编码中,62.9%的地区在2022年12月至2023年3月期间房价有所上涨。另有37.1%的得克萨斯州邮政编码地区房价下跌。(财富中文网)
译者:中慧言-曦莹
大多数房地产分析师预计,2023年美国房地产市场将面临严峻考验。事实上,在29个主要房地产预测模型中,有24个预测2023年全美房价将下跌。
但迄今为止,情况并非完全如此。
在2023年的头几个月里,美国房地产市场持续显示出稳定迹象。今年现有房屋和新建房屋销售略有上升,房地产开发商信心也有所改善。此外,像Zillow、CoreLogic和Black Knight这样的公司都在今年春季报告了月度房价的正增长。
这是怎么回事?首先,随着平均30年固定抵押贷款利率从去年11月的7.37%回落至约6.5%,房屋负担能力在今年春季有所改善。此外,缺乏待售房屋,再加上市场进入繁忙的春季时期,至少目前全美房地产市场已经被推回到了平衡状态。
尽管如此,房地产市场在某些方面仍未完全恢复正常:一些房地产市场(包括斯克兰顿)目前正繁荣发展,而其他地方(包括圣何塞)仍在经历房价调整。甚至在某个特定市场内,情况也可能大相径庭。
为了更好地了解当前房地产市场有多么奇怪和分裂,《财富》杂志制作了七个交互式图表,显示了美国一些最大的州的邮政编码级数据。这些地图表现出从2022年12月到2023年3月,根据季节性调整的Zillow房屋价值指数所跟踪的房价变化。
在Zillow追踪的1559个纽约邮政编码中,48.4%的地区在2022年12月至2023年3月期间房价有所上涨。另有51.6%的地区房价下跌。在2022年同样的三个月时间里,约99%的纽约邮政编码地区出现了房价上涨。
随着4月和5月的房价数据陆续公布,2023年初的部分下跌可能会被抵消。
在Zillow追踪的586个田纳西州邮政编码中,83.1%的地区在2022年12月至2023年3月期间房价有所上涨。另有16.9%的田纳西州邮政编码地区房价下跌。
在Zillow追踪的1563个加州邮政编码中,6.7%的地区在2022年12月至2023年3月期间房价有所上涨。另有93.3%的加州邮政编码地区在这三个月的时间里出现了房价下跌。
在Zillow追踪的1039个俄亥俄州邮政编码中,76.6%的地区在2022年12月至2023年3月期间房价有所上涨。另有23.4%的俄亥俄州邮政编码地区房价下跌。
在Zillow追踪的665个佐治亚州邮政编码中,68.3%的地区在2022年12月至2023年3月期间房价有所上涨。另有31.7%的佐治亚州邮政编码地区房价下跌。
在Zillow追踪的926个佛罗里达州邮政编码中,33.7%的地区在2022年12月至2023年3月期间房价有所上涨。另有66.3%的佛罗里达州邮政编码地区房价下跌。
在Zillow追踪的1554个得克萨斯州邮政编码中,62.9%的地区在2022年12月至2023年3月期间房价有所上涨。另有37.1%的得克萨斯州邮政编码地区房价下跌。(财富中文网)
译者:中慧言-曦莹
Most housing analysts expected 2023 to be a rough year for the U.S. housing market. In fact, among the 29 major housing forecast models, 24 forecasted a national home price decline for 2023.
But so far, that hasn’t exactly come to fruition.
Through the first few months of 2023, the U.S. housing market continues to show signs of stabilization. Existing and new home sales have inched up a bit this year, and homebuilder confidence has improved. And firms like Zillow, CoreLogic, and Black Knight have all reported positive month-over-month home price increases this spring.
What’s going on? For starters, housing affordability has improved this spring as the average 30-year fixed mortgage rate, which topped out at 7.37% in November, came back down to around 6.5%. Additionally, a lack of homes for sale, coupled with the market entering its busier spring period, has—at least for now—pushed the national housing market back into equilibrium.
That said, under the hood, the housing market isn’t exactly normal just yet: Some housing markets are booming right now (including Scranton) while other places (including San Jose) are still passing through a home price correction. And even within a particular market, it can vary a lot.
To better understand just how weird—and divided—the housing market is right now, Fortune built seven interactive charts to display ZIP-code-level data for some of the country’s biggest states. These maps show the change in house prices as tracked by the seasonally adjusted Zillow Home Value Index, between December 2022 and March 2023.
Among the 1,559 New York ZIP codes tracked by Zillow, 48.4% saw a home price increase between December 2022 and March 2023. Another 51.6% saw a home price decrease. During the same three-month window in 2022, around 99% of New York ZIP codes saw positive home price growth.
As home price data rolls in for April and May, it's possible that some of these early 2023 declines get erased.
Among the 586 Tennessee ZIP codes tracked by Zillow, 83.1% saw a home price increase between December 2022 and March 2023. The other 16.9% of Tennessee ZIP codes saw a home price decrease.
Among the 1,563 California ZIP codes tracked by Zillow, 6.7% saw a home price increase between December 2022 and March 2023. The other 93.3% of California ZIP codes saw a home price decrease during that three-month window.
Among the 1,039 Ohio ZIP codes tracked by Zillow, 76.6% saw a home price increase between December 2022 and March 2023. The other 23.4% of Ohio ZIP codes saw a home price decrease.
Among the 665 Georgia ZIP codes tracked by Zillow, 68.3% saw a home price increase between December 2022 and March 2023. The other 31.7% of Georgia ZIP codes saw a home price decrease.
Among the 926 Florida ZIP codes tracked by Zillow, 33.7% saw a home price increase between December 2022 and March 2023. The other 66.3% of Florida ZIP codes saw a home price decrease.
Among the 1,554 Texas ZIP codes tracked by Zillow, 62.9% saw a home price increase between December 2022 and March 2023. The other 37.1% of Texas ZIP codes saw a home price decrease.


